
Note
Go to the end to download the full example code.
Multiway canonical correlation analysis (mCCA)#
Find a set of components which are shared between different datasets.
This example walks through three qualitatively different cases:
no shared structure across datasets,
some shared structure,
fully shared structure.
The goal is to see how the transformed covariance changes as shared structure becomes stronger.
Uses meegkit.cca.mcca().
References#
import matplotlib.pyplot as plt
import numpy as np

from meegkit import cca

rng = np.random.default_rng(5)


def plot_mcca_case(A, C, x, title, interpretation):
    """Plot a standard diagnostic panel for one mCCA scenario."""
    z = x.dot(A)

    fig, axes = plt.subplots(1, 3, figsize=(12, 4))
    axes[0].imshow(A, aspect="auto")
    axes[0].set_title(f"{title}\ntransform matrix")
    axes[0].set_xlabel("Components")
    axes[0].set_ylabel("Original channels")

    axes[1].imshow(A.T.dot(C.dot(A)), aspect="auto")
    axes[1].set_title("Covariance of\ntransformed data")
    axes[1].set_xlabel("Components")
    axes[1].set_ylabel("Components")

    axes[2].imshow(x.T.dot(x.dot(A)), aspect="auto")
    axes[2].set_title("Cross-correlation between\nraw & transformed data")
    axes[2].set_xlabel("transformed")
    axes[2].set_ylabel("raw")
    fig.tight_layout()

    fig2, ax = plt.subplots(1, 1, figsize=(6, 3))
    ax.plot(np.mean(z ** 2, axis=0), "o-")
    ax.set_title(f"{title}\nmean power of transformed components")
    ax.set_xlabel("Component")
    ax.set_ylabel("Mean power")
    ax.grid(True, ls=":", alpha=.4)
    fig2.tight_layout()

    print(f"{title}: {interpretation}")
First example#
We create 3 uncorrelated data sets. There should be no common structure between them.
Build data
x1 = rng.standard_normal((10000, 10))
x2 = rng.standard_normal((10000, 10))
x3 = rng.standard_normal((10000, 10))
x = np.hstack((x1, x2, x3))
C = np.dot(x.T, x)
print(f"Aggregated data covariance shape: {C.shape}")
Aggregated data covariance shape: (30, 30)
Apply CCA
[A, score, AA] = cca.mcca(C, 10)
plot_mcca_case(
    A, C, x,
    title="Case 1: independent datasets",
    interpretation="No component should dominate strongly because nothing is shared.",
)
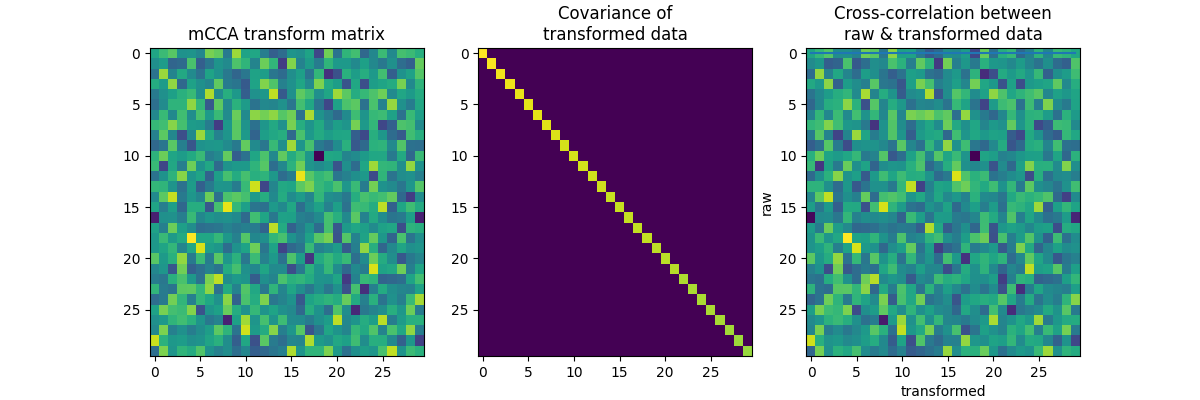
Case 1: independent datasets: No component should dominate strongly because nothing is shared.
Second example#
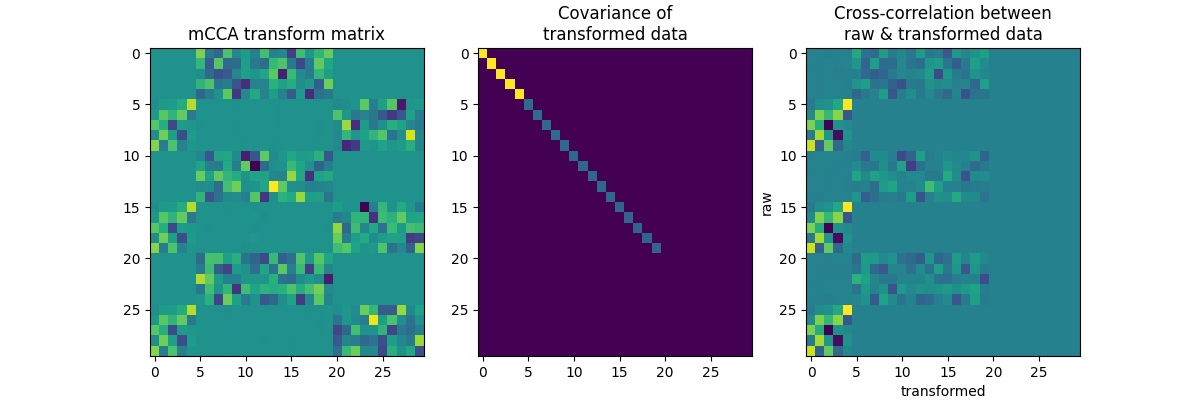
Now Create 3 data sets with some shared parts.
Build data
x1 = rng.standard_normal((10000, 5))
x2 = rng.standard_normal((10000, 5))
x3 = rng.standard_normal((10000, 5))
x4 = rng.standard_normal((10000, 5))
x = np.hstack((x2, x1, x3, x1, x4, x1))
C = np.dot(x.T, x)
print(f"Aggregated data covariance shape: {C.shape}")
Aggregated data covariance shape: (30, 30)
Apply mCCA
A, score, AA = cca.mcca(C, 10)
plot_mcca_case(
    A, C, x,
    title="Case 2: partially shared datasets",
    interpretation="Shared blocks should produce a clearer low-rank structure.",
)
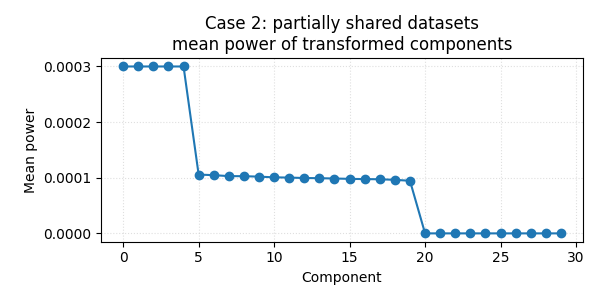
Case 2: partially shared datasets: Shared blocks should produce a clearer low-rank structure.
Third example#
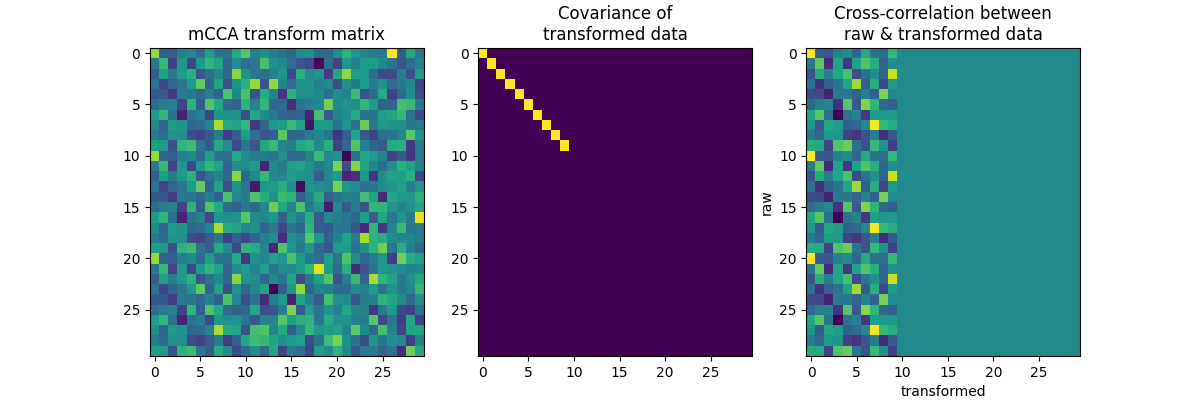
Finally let’s create 3 identical 10-channel data sets. Only 10 worthwhile components should be found, and the transformed dataset should perfectly explain all the variance (empty last two block-columns in the cross-correlation plot).
Build data
x1 = rng.standard_normal((10000, 10))
x = np.hstack((x1, x1, x1))
C = np.dot(x.T, x)
print(f"Aggregated data covariance shape: {C.shape}")
Aggregated data covariance shape: (30, 30)
Compute mCCA
A, score, AA = cca.mcca(C, 10)
plot_mcca_case(
    A, C, x,
    title="Case 3: identical datasets",
   interpretation=(
      "Shared structure is maximal, so the dominant components should be "
      "very clear."
   ),
)
plt.show()
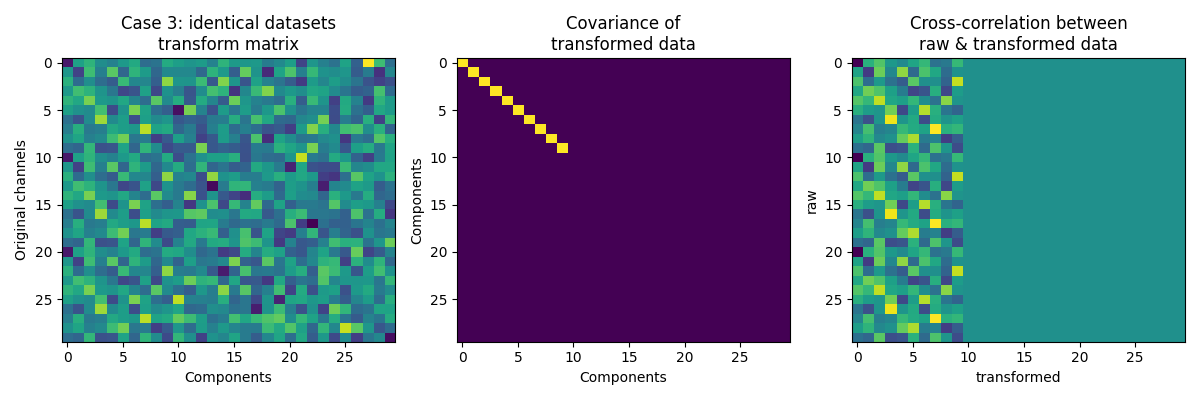
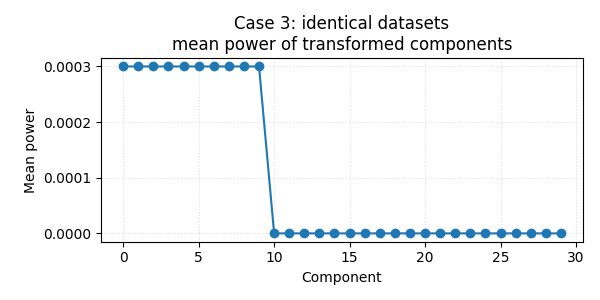
Case 3: identical datasets: Shared structure is maximal, so the dominant components should be very clear.
Total running time of the script: (0 minutes 1.152 seconds)