Note
Go to the end to download the full example code.
Sparse time artifact removal on simulated data#
This example is similar to test_nt_star.m in Noisetools. Results are equivalent (within numerical precision) to the Matlab code.
Uses meegkit.star.star().
The important comparison is between the contaminated signal and the residual after STAR. Because the ground-truth clean signal is known here, we can also quantify how much the denoised output approaches it.
References#
import matplotlib.pyplot as plt
import numpy as np

from meegkit import star
from meegkit.utils import demean, normcol

rng = np.random.default_rng(9)
Create simulated data#
Simulated data consist of N channels, 1 sinusoidal target, N-3 noise sources, with temporally local artifacts on each channel.
# Create simulated data
nchans = 10
n_samples = 1000
f = 2
target = np.sin(np.arange(n_samples) / n_samples * 2 * np.pi * f)
target = target[:, np.newaxis]
noise = rng.standard_normal((n_samples, nchans - 3))

# Create artifact signal
SNR = np.sqrt(1)
x0 = normcol(np.dot(noise, rng.standard_normal((noise.shape[1], nchans)))) + \
    SNR * target * rng.standard_normal((1, nchans))
x0 = demean(x0)
artifact = np.zeros(x0.shape)
for k in np.arange(nchans):
    artifact[k * 100 + np.arange(20), k] = 1
x = x0 + 10 * artifact

# This is to compare with matlab numerically
# from scipy.io import loadmat
# mat = loadmat('/Users/nicolas/Toolboxes/NoiseTools/TEST/X.mat')
# x = mat['x']
# x0 = mat['x0']
Apply STAR#
y, w, _ = star.star(x, 2)
residual = demean(y) - x0
source_corr_before = np.corrcoef(x[:, 0], x0[:, 0])[0, 1]
source_corr_after = np.corrcoef(y[:, 0], x0[:, 0])[0, 1]
proportion artifact free: 0.70
proportion artifact free: 0.70
proportion artifact free: 0.70
depth: 1
fixed channels: 10
fixed samples: 299
ratio: 1.01
power ratio: 0.40
Plot results#
What to look for: - Local spikes should be strongly reduced after STAR. - The residual should be dominated by artifact remnants, not the target. - Correlation with the clean reference should improve after denoising.
f, (ax1, ax2, ax3) = plt.subplots(3, 1)
ax1.plot(x, lw=.5)
ax1.set_title(f"Signal + Artifacts (SNR = {SNR}, corr = {source_corr_before:.2f})")
ax1.set_ylabel("Amplitude")
ax2.plot(y, lw=.5)
ax2.set_title(f"Denoised (corr = {source_corr_after:.2f})")
ax2.set_ylabel("Amplitude")
ax3.plot(residual, lw=.5)
ax3.set_title("Residual")
ax3.set_ylabel("Amplitude")
ax3.set_xlabel("Samples")
f.set_tight_layout(True)
print(f"Correlation with clean reference before STAR: {source_corr_before:.3f}")
print(f"Correlation with clean reference after STAR:  {source_corr_after:.3f}")
plt.show()
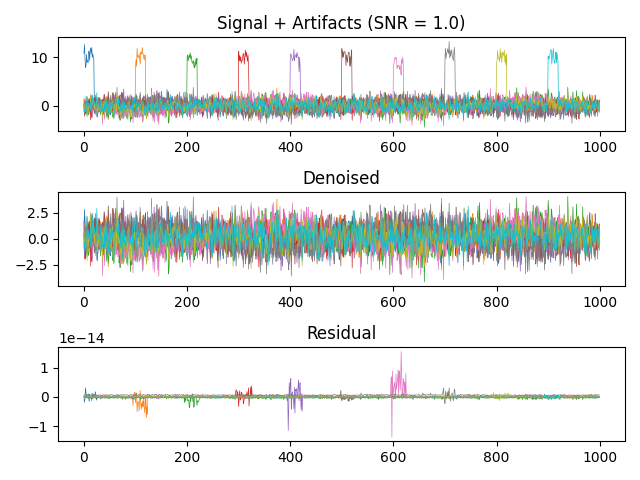
Correlation with clean reference before STAR: 0.610
Correlation with clean reference after STAR:  1.000
Total running time of the script: (0 minutes 0.306 seconds)