Note
Go to the end to download the full example code.
Causal phase estimation example#
This example shows how to causally estimate the phase of a signal using two oscillator models, as described in [1].
It compares three causal estimators against the Hilbert phase reference and reports mean absolute phase errors.
Uses meegkit.phase.ResOscillator() and meegkit.phase.NonResOscillator().
The comparison is easiest to read through the phase-difference traces and the printed mean absolute phase errors.
References#
import matplotlib.pyplot as plt
import numpy as np
from scipy.signal import hilbert

from meegkit.phase import NonResOscillator, ResOscillator, locking_based_phase


def phase_difference(phi1, phi2):
    """Compute circular phase difference between two phase arrays."""
    cos_phi_dif = np.cos(phi1) * np.cos(phi2) + np.sin(phi1) * np.sin(phi2)
    sin_phi_dif = np.sin(phi1) * np.cos(phi2) - np.cos(phi1) * np.sin(phi2)
    return np.arctan2(sin_phi_dif, cos_phi_dif)


def generate_multi_comp_data(npt=40000, fs=100):
    """Generate multi-component data with frequency modulation."""
    dt = 1 / fs
    t = np.arange(1, npt + 1) * dt
    omega1 = np.sqrt(2) / 30
    omega2 = np.sqrt(5) / 60
    amp = 1 + 0.95 * np.cos(omega1 * t)
    p = t + 5 * np.sin(omega2 * t)
    s = (
        np.cos(p)
        + 0.2 * np.cos(2 * p + np.pi / 6)
        + 0.1 * np.cos(3 * p + np.pi / 3)
    )
    s *= amp
    return s
Build data#
First, we generate a multi-component signal with amplitude and phase modulations, as described in the paper [1].
npt = 40000
fs = 100
s  = generate_multi_comp_data(npt, fs)  # Generate test data
dt = 1 / fs
time = np.arange(npt) * dt
Visualize signal#
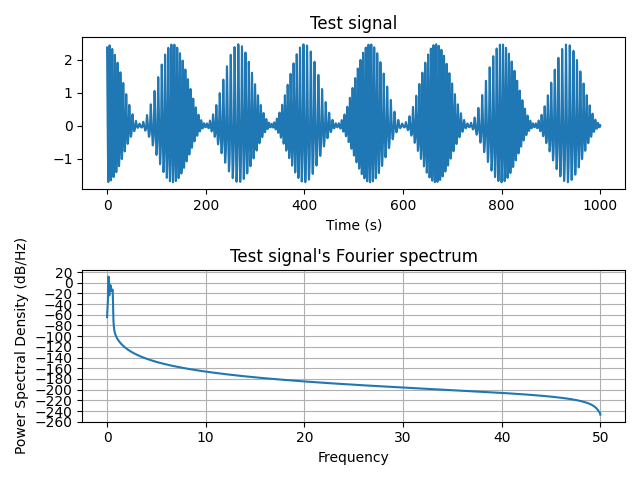
Plot the test signal’s Fourier spectrum
f, ax = plt.subplots(2, 1)
ax[0].plot(time, s)
ax[0].set_xlabel("Time (s)")
ax[0].set_title("Test signal")
ax[1].psd(s, Fs=fs, NFFT=2048*4, noverlap=fs)
ax[1].set_title("Test signal's Fourier spectrum")
plt.tight_layout()
Compute phase and amplitude#
We compute the Hilbert phase and amplitude, as well as the phase and amplitude obtained by the locking-based technique, non-resonant and resonant oscillator.
ht_ampl = np.abs(hilbert(s))  # Hilbert amplitude
ht_phase = np.angle(hilbert(s))  # Hilbert phase

lb_phase = locking_based_phase(s, dt, npt)
lb_phi_dif = phase_difference(ht_phase, lb_phase)

osc = NonResOscillator(fs, 1.1)
nr_phase, nr_ampl = osc.transform(s)
nr_phase = nr_phase[:, 0]
nr_phi_dif = phase_difference(ht_phase, nr_phase)

osc = ResOscillator(fs, 1.1)
r_phase, r_ampl = osc.transform(s)
r_phase = r_phase[:, 0]
r_phi_dif = phase_difference(ht_phase, r_phase)

print(f"Mean absolute phase error, locking-based: {np.mean(np.abs(lb_phi_dif)):.3f}")
print(f"Mean absolute phase error, nonresonant:   {np.mean(np.abs(nr_phi_dif)):.3f}")
print(f"Mean absolute phase error, resonant:      {np.mean(np.abs(r_phi_dif)):.3f}")
print("Interpretation: smaller mean absolute phase error indicates a closer")
print("match to the Hilbert phase reference.")
/home/runner/work/python-meegkit/python-meegkit/meegkit/utils/buffer.py:68: UserWarning: Buffer overflow: some old data has been discarded
  warnings.warn("Buffer overflow: some old data has been discarded")
Mean absolute phase error, locking-based: 0.263
Mean absolute phase error, nonresonant:   0.261
Mean absolute phase error, resonant:      0.198
Interpretation: smaller mean absolute phase error indicates a closer
match to the Hilbert phase reference.
Results#
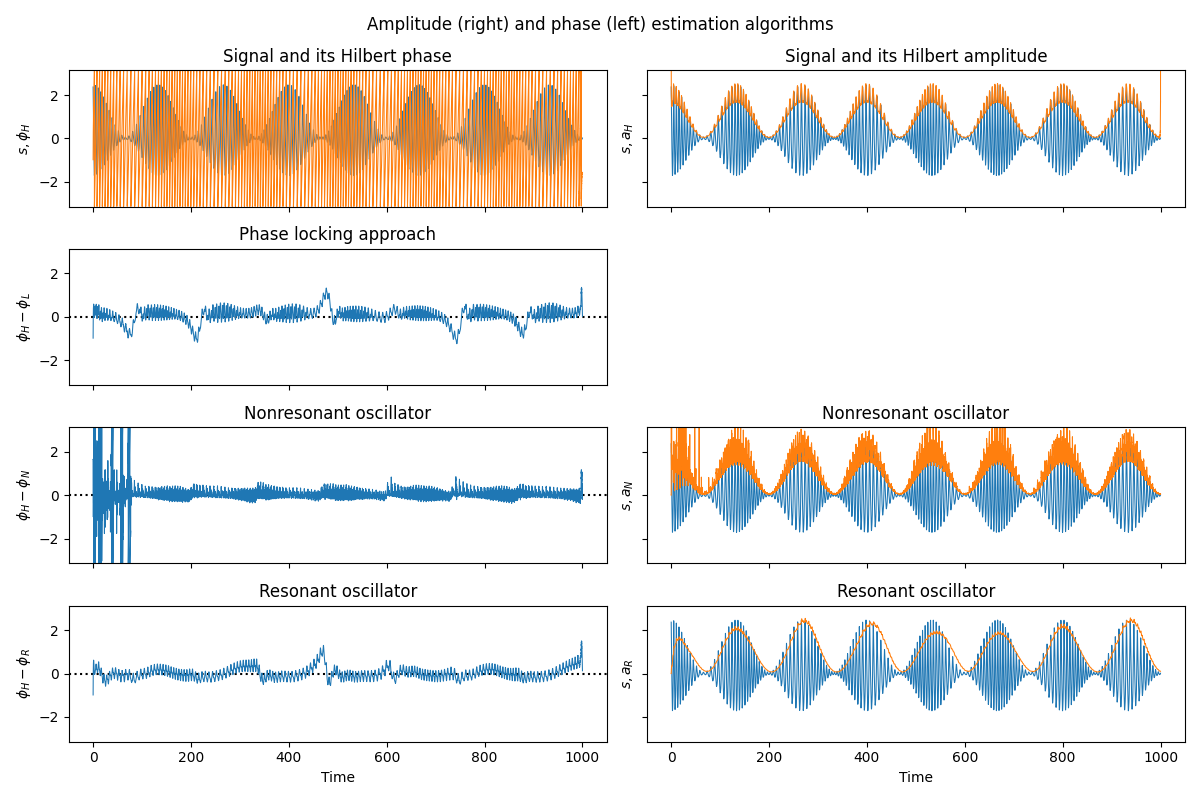
Here we reproduce figure 1 from the original paper [1].
The first row shows the test signal \(s\) and its Hilbert amplitude \(a_H\) ; one can see that ah does not represent a good envelope for \(s\). On the contrary, the Hilbert-based phase estimation yields good results, and therefore we take it for the ground truth. Rows 2-4 show the difference between the Hilbert phase and causally estimated phases (\(\phi_L\), \(\phi_N\), \(\phi_R\)) are obtained by means of the locking-based technique, non-resonant and resonant oscillator, respectively). These panels demonstrate that the output of the developed causal algorithms is very close to the HT-phase. Notice that we show \(\phi_H - \phi_N\) modulo \(2\pi\), since the phase difference is not bounded.
f, ax = plt.subplots(4, 2, sharex=True, sharey=True, figsize=(12, 8))
ax[0, 0].plot(time, s, time, ht_phase, lw=.75)
ax[0, 0].set_ylabel(r"$s,\phi_H$")
ax[0, 0].set_title("Signal and its Hilbert phase")

ax[1, 0].plot(time, lb_phi_dif, lw=.75)
ax[1, 0].axhline(0, color="k", ls=":", zorder=-1)
ax[1, 0].set_ylabel(r"$\phi_H - \phi_L$")
ax[1, 0].set_ylim([-np.pi, np.pi])
ax[1, 0].set_title("Phase locking approach")

ax[2, 0].plot(time, nr_phi_dif, lw=.75)
ax[2, 0].axhline(0, color="k", ls=":", zorder=-1)
ax[2, 0].set_ylabel(r"$\phi_H - \phi_N$")
ax[2, 0].set_ylim([-np.pi, np.pi])
ax[2, 0].set_title("Nonresonant oscillator")

ax[3, 0].plot(time, r_phi_dif, lw=.75)
ax[3, 0].axhline(0, color="k", ls=":", zorder=-1)
ax[3, 0].set_ylim([-np.pi, np.pi])
ax[3, 0].set_ylabel(r"$\phi_H - \phi_R$")
ax[3, 0].set_xlabel("Time")
ax[3, 0].set_title("Resonant oscillator")

ax[0, 1].plot(time, s, time, ht_ampl, lw=.75)
ax[0, 1].set_ylabel(r"$s,a_H$")
ax[0, 1].set_title("Signal and its Hilbert amplitude")

ax[1, 1].axis("off")

ax[2, 1].plot(time, s, time, nr_ampl, lw=.75)
ax[2, 1].set_ylabel(r"$s,a_N$")
ax[2, 1].set_title("Amplitudes")
ax[2, 1].set_title("Nonresonant oscillator")

ax[3, 1].plot(time, s, time, r_ampl, lw=.75)
ax[3, 1].set_xlabel("Time")
ax[3, 1].set_ylabel(r"$s,a_R$")
ax[3, 1].set_title("Resonant oscillator")
plt.suptitle("Amplitude (right) and phase (left) estimation algorithms")
plt.tight_layout()
plt.show()
Total running time of the script: (0 minutes 4.469 seconds)